Most people believe numbers, graphs, and statistics don’t lie, but one viral graph sent social media users into a frenzy over its misleading comparisons of pop stars.
The viral graph compared the heights of some of the most popular divas who are dominating the industry today. But netizens raised their eyebrows over how the tallest singers appeared to gigantically tower over their miniscule-looking peers.
HighlightsA deceptive graph comparing the heights of pop stars triggered wild reactions online.The graph included Taylor Swift, Beyoncé, Selena Gomez, Ariana Grande, Sabrina Carpenter, and others.“I think the creator was working through their kink,” one commenter said.The image sparked discussions about how such graphs can sometimes be misleading.
The image also sparked discussions about how such graphs can sometimes be deceptive in conveying information.
RELATED:
A deceptive graph comparing the heights of pop divas led to wild reactions online

Image credits:Axelle/Bauer-Griffin/FilmMagic via Getty Images
The chaos-causing graph featured Taylor Swift, Megan Thee Stallion, Dua Lipa, Beyoncé, Selena Gomez, Ariana Grande, and Sabrina Carpenter.
Music chart-topping Taylor Swift was the imposing topper of the graph as well,standing tall at 5 ft 10.
On the far left side, Sabrina Carpenter, who stands at around 5’0, was made to look like a pocket-sized figurine in comparison.
Taylor Swift and Megan Thee Stallion were seen towering over pocked-sized versions of Ariana Grande and Sabrina Carpenter in the image

Image credits:Ariana Grande

Image credits:Sabrina Carpenter
“This raises the old question: would you rather fight one Taylor-sized Sabrina Carpenter, or a hundred Sabrina-sized Taylor Swifts?” one commenter wrote.
“I think the creator was working through their kink,” read a second comment, while a third wrote, “So Ariana.. not so Grande after all?”
View this post on Instagram
“This feels likefetish material,” read another remark.
Others spoke about how deceptive and manipulative some visual representations can be.
“There should be an instance where you can report these horrible graph crimes,” read one comment, while a second said, “Welcome to Not Trusting Graphs 101. Graphs can tell a story, but it can be heavily distorted.”
“This feels like fetish material,” read one comment on the viral graph
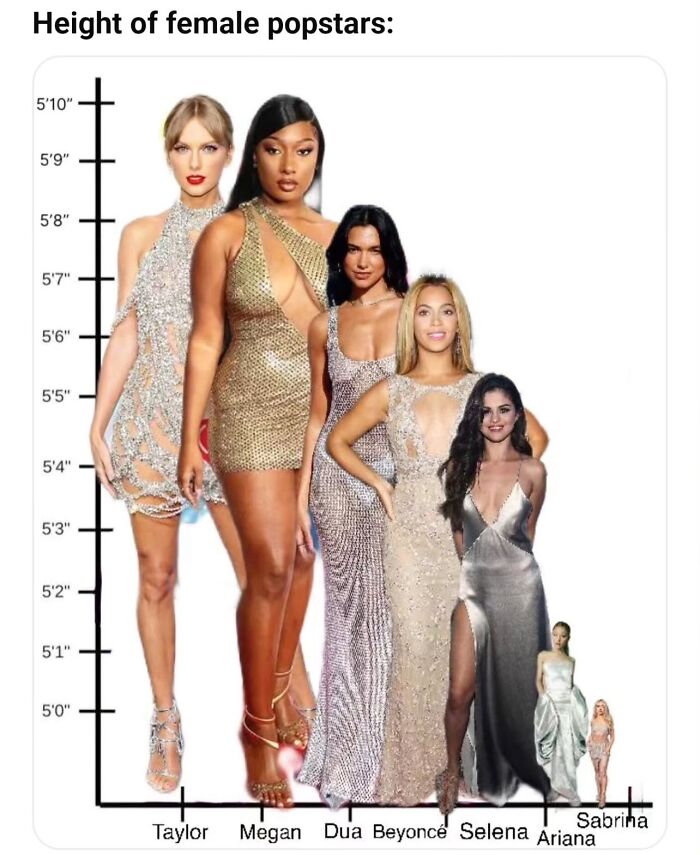
Image credits:Imgur
“This is how the Media tells stories,” another wrote.
“This is actually a good chart to show how data can be visually skewed to not represent reality even if the numbers are fully accurate,” said another.
One wrote, “Honestly, it’s actually a pretty good way of showing people how mainstream tabloids build their charts when they want to manipulate their readership.”
The graph sparked a broader conversation about how data can be manipulated to mislead people
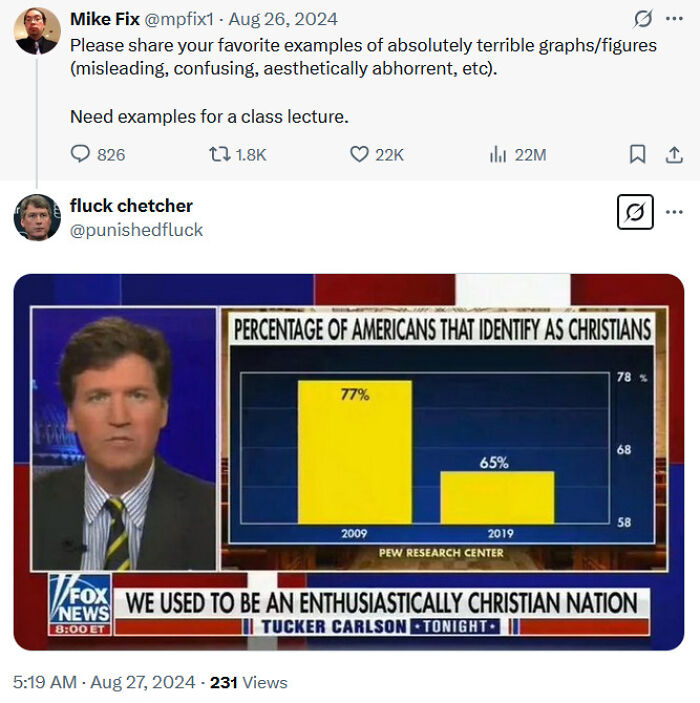
Image credits:fluck chetcher / X
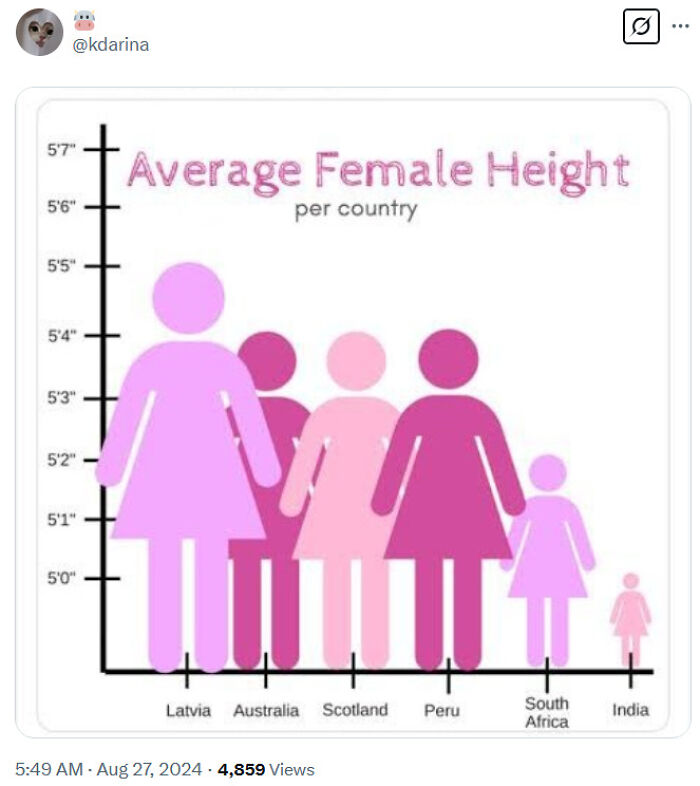
Image credits:@kdarina / X
British statistician David Spiegelhalter once spoke about how he got “very grumpy” over an official graph of teenage pregnancy rates in the UK.
A lecturer on X asked for “absolutely terrible graphs/figures” and received a flood of responses
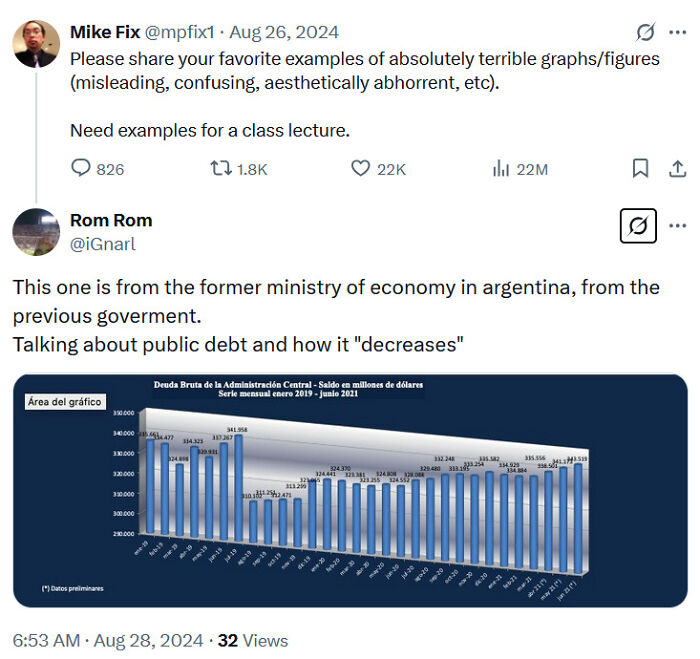
Image credits:Rom Rom / X
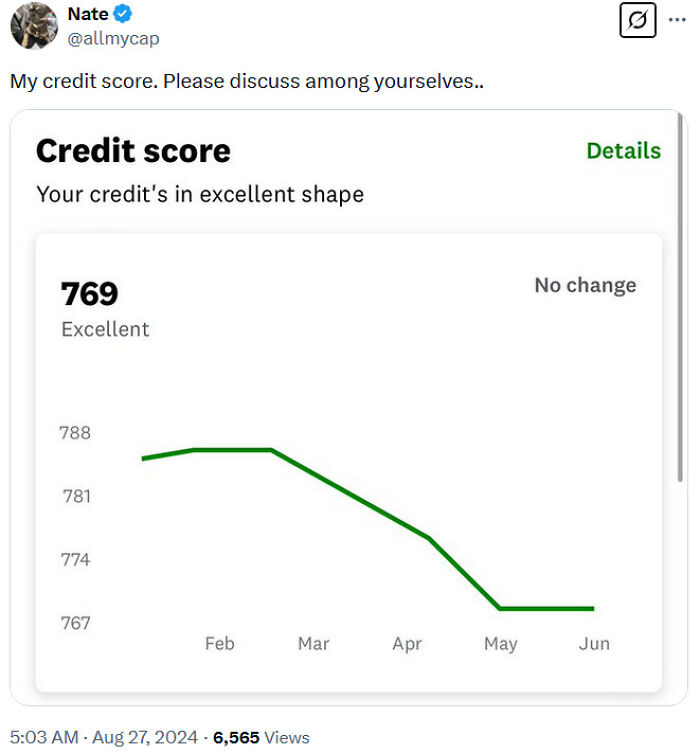
Image credits:Nate / X
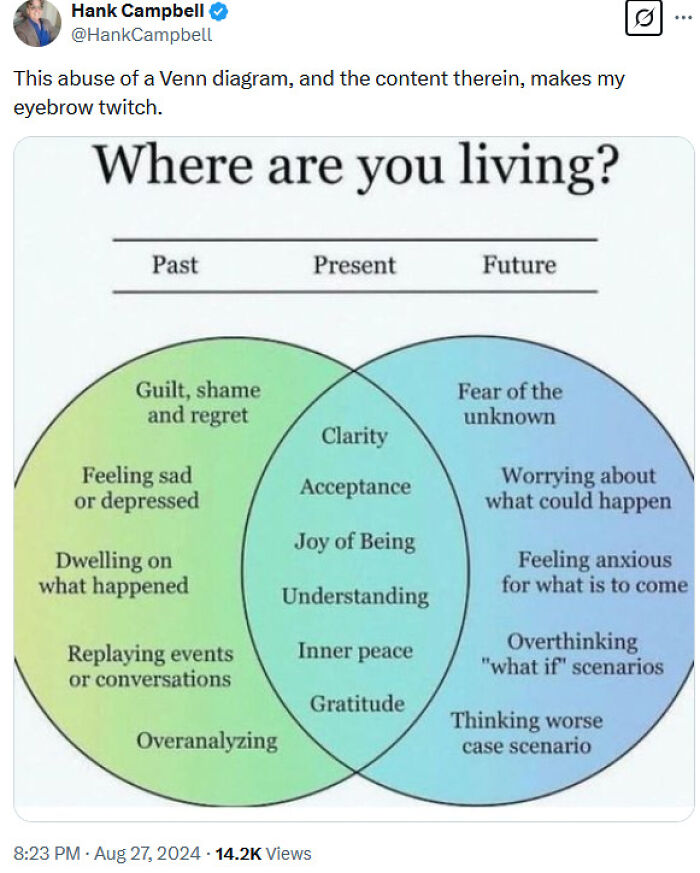
Image credits:Hank Campbell / X
The data “apparently showed they had declined to nearly zero,” the statistician toldQZ. “Until I realized that the bottom part of the axis had been cut off, which made it impossible to visualize the (very impressive) 50% reduction since 2000.”
He noted thatgraphs “can be as manipulative” as words.
“Using tricks such as cutting axes, rescaling things, changing data from positive to negative, etc.,” are some ways through which people can be misled.
Cutting axes and deceptively rescaling are some ways through which graphs can be deceptive
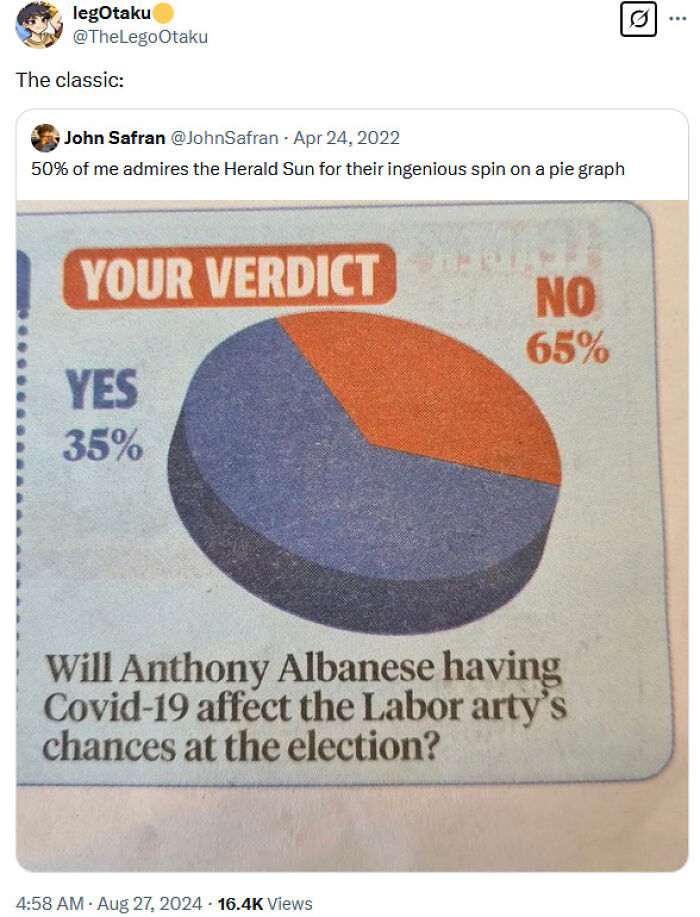
Image credits:John Safran / legOtaku / X
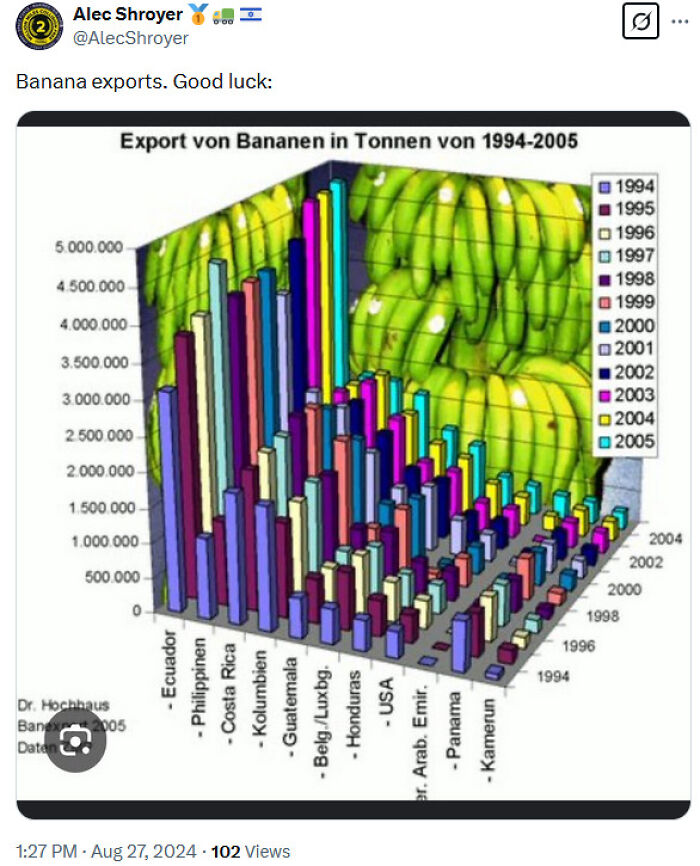
Image credits:Alec Shroyer / X
“Sometimes, putting zero on the y-axis is wrong. So to be sure that you are communicating the right things,you need to evaluate the messagethat people are taking away,” he went on to say.
David pointed out that there are no “absolute rules” when it comes to visually conveying data.
“It all depends on what you want to communicate,” he added.You May LikePassengers Upset After Plane Makes Emergency Landing Due To “Serious Medical” Crisis On BoardKarina BabenokFather Beats Up Lifeguard After He Saved His Boy’s LifeLei RVDisney Worker Downloads Free AI Tool—Loses Job And $200,000 BonusesLei RV
Karina Babenok
Lei RV
![]()
![]()
News
